Step 4
Further applications - Peptide summary function, pH vs charge plot, Isoelectric point calculator
For steps 1-3, hopefully most students were able to follow along and complete the objectives. The point of this project is to show that even without an extensive knowledge of coding, it is possible to take published scripts and functions and use them for your own data, even making simple modifications. Step 4 involves writing your own code from scratch, which I acknowledge takes more experience and more extensive background knowledge with a programming language. However, there are many excellent free resources online for diving into this sort of challenge. The best way to start out coding from scratch is to identify a question and work at it until a solution presents itself. In this section I will present several ‘questions’ that relate to the problems discussed in steps 1-3. There are many ways to successfully complete these challenges, but I will post possible solutions for each one here on git-hub. They are roughly in order of difficulty from easiest to hardest.
There are some general tips at the bottom of this page if you are stuck but don’t want to look at the answers! In addition, going back to Tutorialspoint.com after you have done some exercises can be a great way to reinforce what you’ve learned and pick up on new stuff. Finally, here is another good tutorial on writing your own functions from Software Carptentry. They have many other good tutorials as well.
Make a good faith effort at trying these out from scratch. However, don’t be afraid to use the example solutions from the link above for hints if you are really stuck. Remember, being able to take code from other places and use it for your own data is a useful skill!
Exercise (4a)
We now have functions that calculate the charge of a peptide, the mass of a peptide, the m/z at a given pH of a peptide, and the expected m/z of a peptide in a MALDI spectrum. It would be helpful if we had a function that could summarize all of them. The goal for this function is to take a peptide and a pH, and print out all of the attributes we can calculate. Here is a framework with which to write your function.
peptide_summary <- function(peptide, pH){

  #Your code goes here

}
You will have to use the print() function to make this work. Briefly, print() will print anything within the parentheses to the console. This can be a value (e.g. print(7) will print “7”), or it can be a variable (e.g. my_name <- "Simon" followed by print(my_name) will print “Simon”). You can even call another function within print (e.g. print(toupper("simon")) will print “SIMON”, where ‘toupper()’ is a function that converts lowercase letters to capital letters. See the bottom of this page for a comparison between print and return.
Take a screenshot of your code and paste it into the assignment. Use your peptide_summary() function to calculate all the attributes for your favorite peptide (You can make one up!)
Exercise (4b)
We have a function that can calculate the charge of a peptide at any given pH. Can we use this to create a plot of the charge of a peptide over a large range of pH? This is useful for quickly estimating the isoelectric point of a peptide, or predicting its behavior in different buffers or separation methods. The goal of this exercise is to create a plot like this, which is for the peptide DIAK: 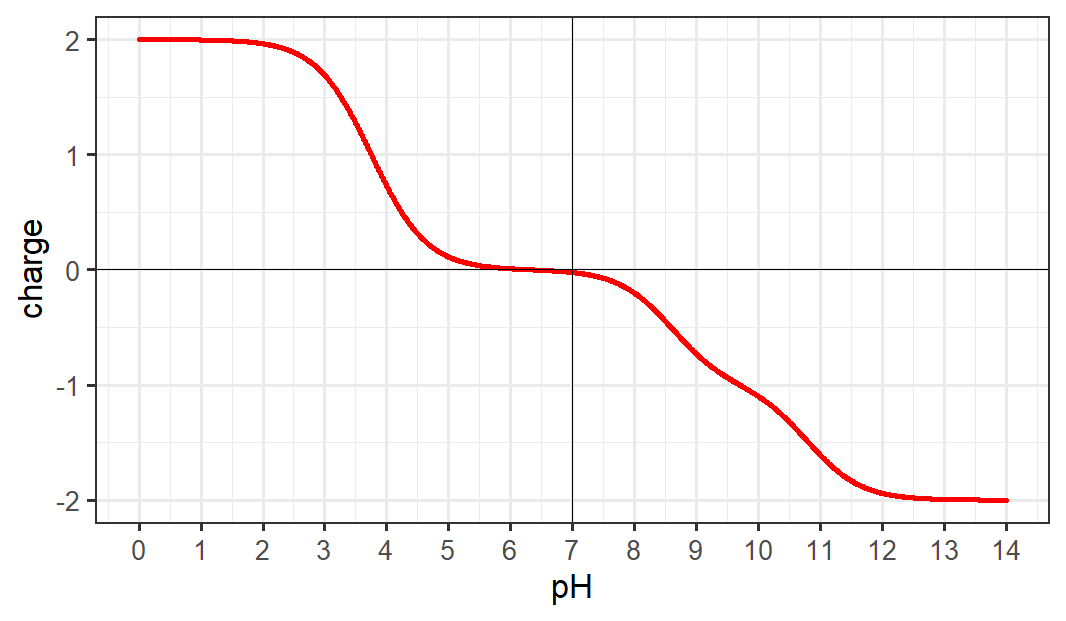 This takes some knowledge of how to create plots in R. The easiest way is to simply call two vectors or lists which are x and y coordinates to the function
 plot() like this plot(pH_list, charge_list). If you are interested in data visualization, there is a very powerful package called ggplot2 that is relatively easy to understand and can create beautiful graphs and charts.
Try doing this from scratch. Some pseudocode is below to help you get started if you are stuck.
Pseudo code:

pH is a list of 1000 pH values from 0 to 14
charge is a list of 1000 values

for each value in list pH,
  calculate the charge for peptide "DIAK" and store it in the list charge

plot pH and charge
Helpful functions:
seq(x, y, z) creates a vector of numbers that goes from x to y, incrementing by z
rep(x, y) creates a vector of length y, and each value is x
length(x) returns the length of a vector or list xTake a screenshot of your code and paste it into the assignment. Also take a screenshot of the plot for your favorite peptide (you can make one up!) and paste it into the assignment.
Exercise (4c)
Isoelectric point is the point that a protein or peptide has a net charge of 0. We can estimate this based on the graph we created in Exercise 4b (for DIAK it is approximately 6.3) but it would be helpful if we were able to create a function that calculated this for us. Here is a framework for the function:
pep_pI <- function(peptide){

  #your code goes here

}
A paper from Dr. Kozlowski nicely presents a methodology to do this. The general idea is to start at an ‘average’ pH (let’s use 7) and see what the charge is. Depending on whether it is positive or negative, try a new pH that is lower or higher, and repeat this process until you reach zero charge. There are several things to consider.:
- How far do we move from the previous pH value to the new one?
- Do we do this an arbitrary number of times? OR
- Do we do this until the charge is close enough to zero?
An easy answer to the first question is to simply divide the search area in half each time. For example, suppose we try pH 7 and get a negative charge value. We know the pI will be lower than pH 7, so we divide the pH range 0-7 in half and try again at 3.5. This time, the charge is positive, so we know that the pI is higher than 3.5, but lower than 7. Now we divide this range in half and try again at 5.25. We continue this process either for a certain number of iterations, or until the charge is close enough to zero.
Take a screenshot of your code and paste it into the assignment. Calculate the pI of one of the peptides from exercise 2 or 3, and report that value in the assignment.
Additional Exercises
Some additional questions and exercises are listed below. Feel free to get creative and answer your own questions!
- How would we deal with peptides that are modified? For example: DALC:mK, where the C:m is a modified cysteine residue.
- Run a comparison study between three different sets of pKa values on a standard set of peptides.
- create a peptide mass function that uses average mass instead of mono-isotopic mass.
Helpful tips
Anatomy of a function
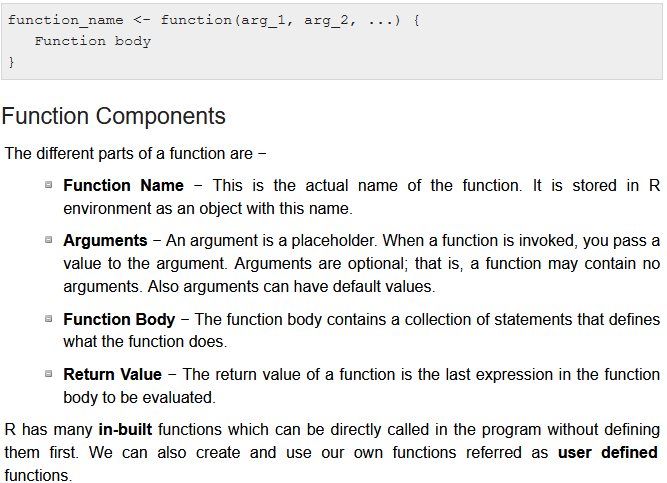
From tutorialspoint.com/r
How to call a function within a function
This is an incredibly important aspect of writing functions. You often want to create a function that makes use of another function that you’ve already written. For an example of this, go back to Step 1 and look at the pep_charge() function. This is a function that is written from scratch, but it uses several other functions within it. The first thing it does, is to call the function toupper() on peptide. It then assigns the result of this computation to the variable peptide, essentially overriding it. toupper() is a function, and you can use it (or any other function) within another function the same way you would in the terminal: typing it and supplying arguments. However, within a function, you often want to assign the output of the function to a variable with the <- symbol. See if you can find other examples of this throughout the exercise, like in the pep_mass() function.
The difference between print() and return()
print() is simply a function to show the user the result of some calculation, by ‘printing’ it in the terminal. The computer can’t use this value. return() is often used within a function, and it stores or ‘returns’ the result of a calculation so that the computer is able to use it. This value is what is saved when the output of a function is stored in a variable. Using print() won’t disrupt a function (it is only there for the user’s benefit), but using return() will end a function.